Individual Participant Report

The individual feedback report (the PDF report a participant receives after feedback has been gathered) is highly configurable. This section will cover the core and optional components of the individual feedback report. Click here to download a sample report.  Items below in bold are core/standard components of the report.  

  • Cover Page
  • Introductory Letter-Optional
  • Rater Summary-Optional
  • Foundational Competencies-Optional
  • Competency Summary
  • Competency Distribution-Optional
  • Focus Areas
  • Competencies and Behavioral Statements
  • Key Metrics- Optional
  • Derailers
  • Gap Analysis- Optional
  • Comments
  • Behavior Summary-Optional
  • Action Planning-Optional
  • Trending-Optional
  • Recommendations-Optional

Cover Page

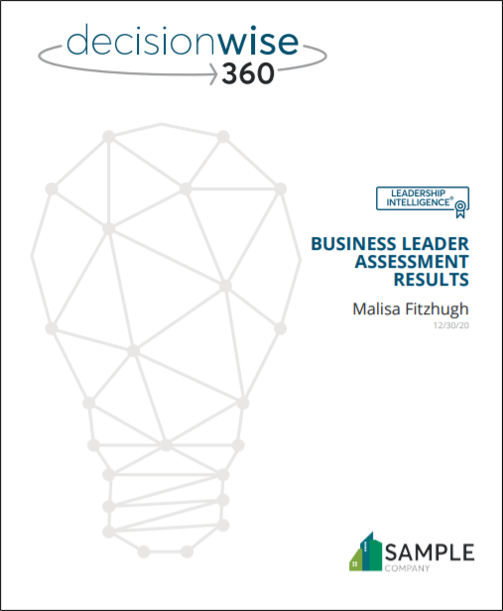
The cover page displays several items important to the report.

  1. The DecisionWise Logo is included for all clients who are taking the assessment as a DecisionWise client. For consultants who wish to include their logo, please contact support for additional instructions.
  2. Leadership Intelligence® Certified Seal. This seal will appear on all DecisionWise validated assessments. This seal demonstrates that the assessment has been tested and validated by DecisionWise. Custom built assessments will not display this seal. 
  3. The Assessment Name shows which type of assessment the participant has completed.
  4. The Participant Name. The name of the participant is displayed on the cover page to simplify distribution. The date shows the date the report was generated, not the date the feedback was collected.  
  5. Company Logo. Your logo can be included on the reports for additional branding benefits.
Introductory Letter

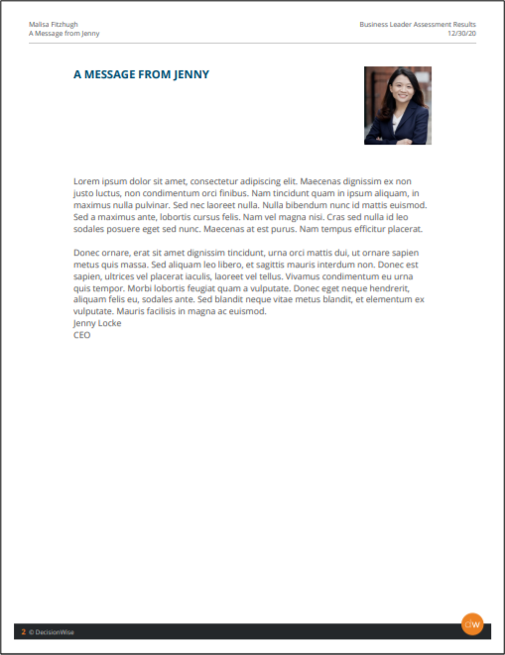
The introductory letter provides an opportunity for to include a letter from a senior member of your team, like the CEO, vice president, or manager. For instructions on setting up the introductory letter, click here.

Rater Summary Page

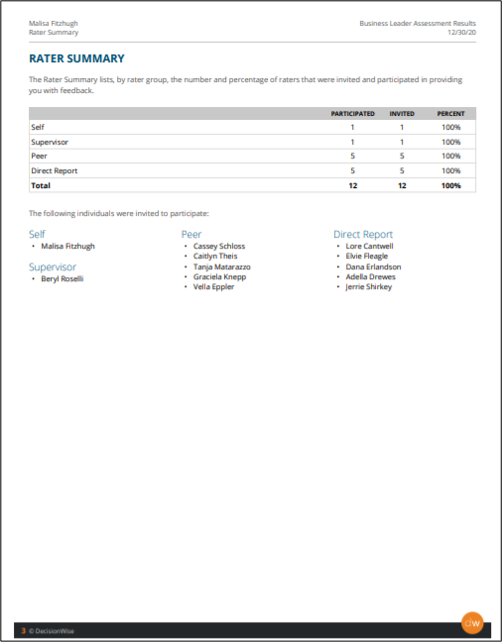
The rater summary page in the individual feedback report has 2 sections:

  1. A participation report that shows the number of people who were asked to participate and the number of those who completed the assessment. 
  2. This section also reminds the participant of all raters who were invited to participate.

Best Practice: To maintain confidentiality, the report should never display feedback from a single rater unless that person is the participant or the participant’s supervisor.  

Foundational Competencies Page

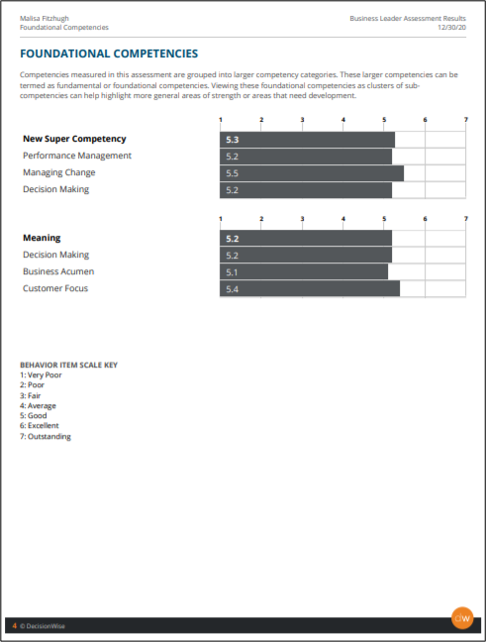
This is an optional section of the report. Foundational competencies are groups of competencies that are most critical to a leader’s success as either identified by DecisionWise in its assessments or by your organization in your customized assessments. Foundational competencies are displayed with their associated sub competencies. This information highlights possible areas of strength or areas that may need additional growth and development.

To learn how to set up additional Foundational Competencies, click here.

Competency Summary Page

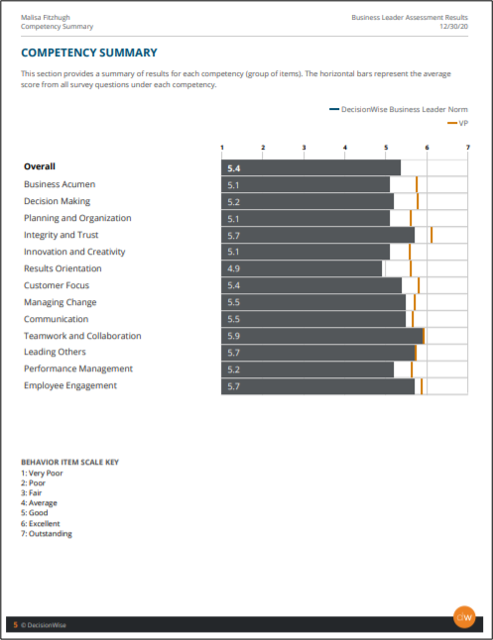
This core section of the report provides a summary of the results for each competency.  A competency contains 2-6 behavior statements that have been evaluated by the various raters, including the participant. The gray horizontal bars represent the average score from the various behavior statements grouped under each competency.

Normative data can be added to show how a participant scored relative to the norm. The orange vertical line in this sample shows how normative data is displayed in the report.

For more information on setting up normative data, click here.

Competency Score Distribution Page

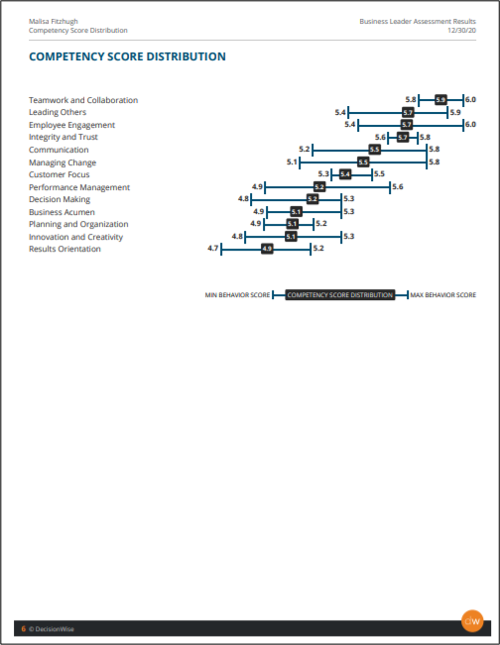
The “Competency Score Distribution” whisker graph is an optional section of the report. In this section, participants can see the range of their scores from the various behavior statements that make up the competency. The lowest behavior score is on the left of the graph with the highest on the right. The score in the middle box represents the participant’s average score for the competency.  

Focus Areas Page

The “Focus Areas” table is a standard section of the report. This section shows the highest scoring behavior statements and the lowest scoring statements. Included with this visualization is the competency to which the statement belongs. 

Please note that the generated PDF report is interactive. By clicking the competency you will be taken to that specific competency page in the report.  

Best Practice: While it is natural to focus on a participant’s lowest scoring items, it is equally, if not more, important to focus on and highlight a participant’s strengths.

Competencies and Behavior Statements Page

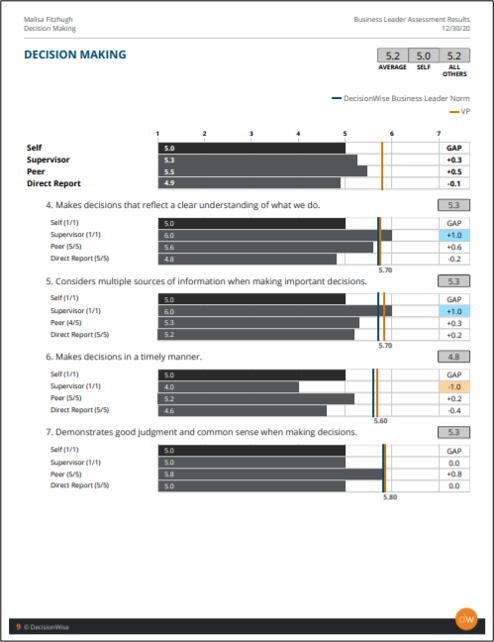
This section is standard in the report. This is where data for a competency is fully visualized. These are the core elements of this section:

  1. The competency name.
  2. The competency scores by self, all other raters, and the average.
  3. A legend to show which colored lines represent normative data points.
  4. The aggregate score from each rater group.
  5. The name of each rater group and the number of raters who evaluated that particular behavior statement (there are times when a rater may skip a particular statement and the number will reflect how many raters evaluated a particular item).
  6. The gap score on the right of each rater group shows the score gap between the self score and the raters’ group score (conditional highlighting is used to identify larger gaps).
  7. The colored lines show the displayed normative benchmark data. The number score will show on the first selected norm line. Click here to see more on normative data.

Key Metrics Page

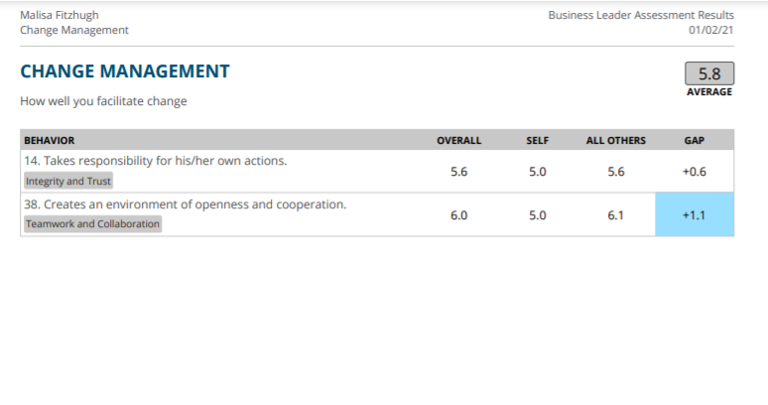
The “Key Metrics” page is an optional section in the report. There are times when you may wish to display and group behavior statements that span multiple competencies. This setting allows you to create a “key metric” to evaluate and display these types of grouped behavior statements.

Examples of key metrics might be Diversity, Equity, and Inclusion, or Workplace Safety. 

For more information on setting up Key Metrics, click here. 

Derailers Page

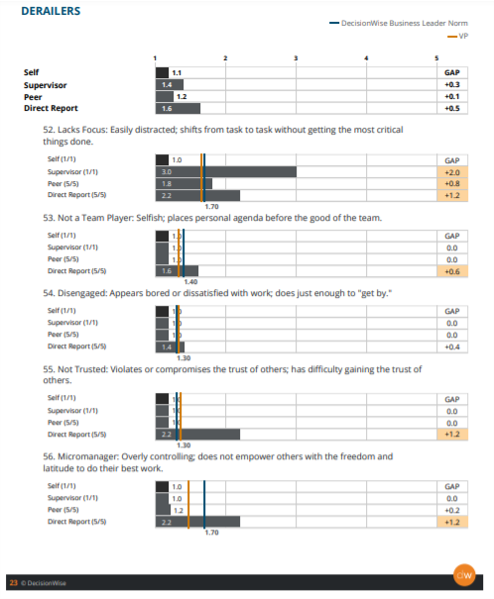
The Derailer section is standard in the report. A leadership derailer is a behavioral tendency that gets in the way of our progress. Sometimes, a derailer represents an overused strength or it may represent a lack of awareness in a particular area. It has been suggested that derailers help us evaluate a participant’s emotional intelligence. Derailers examine “how” we do things in addition to “what” we do.  

  1. A derailer has the potential to limit one’s progress.
  2. A derailer can often be linked to an ability that is taken to an extreme.
  3. Multiple strengths cannot compensate for a derailer. 
Please Note: The scale in the derailers section shifts from a traditional 7-point scale to a 5-point scale, and the scale’s orientation is reversed (“none” or “very little” is better than “a lot”). Derailers also display normative data and gaps, similar to the competencies.

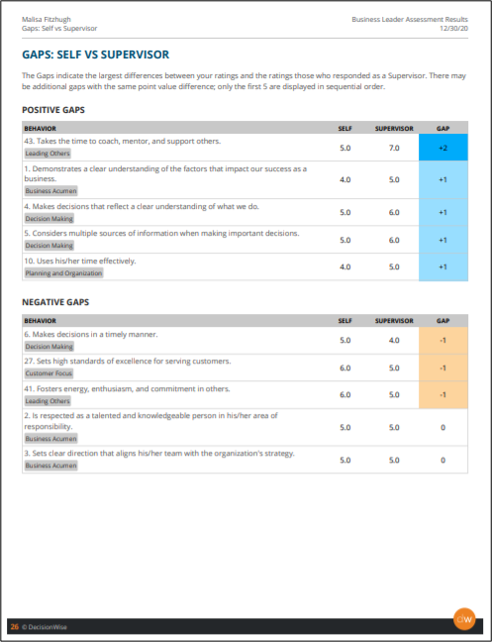
Gap Analysis Page

The “Gap Analysis” is an optional section that show:

  1. Score gaps between the self score and the supervisor score.
  2. Score gaps between the self score and each of the rater groups (each rater group will be on shown on a unique page). 

A positive gap represents a score higher than the self score. A negative gap represents a score lower than the self score. This page uses conditional highlighting to help identify larger gaps, either positive or negative.  

Comments Page

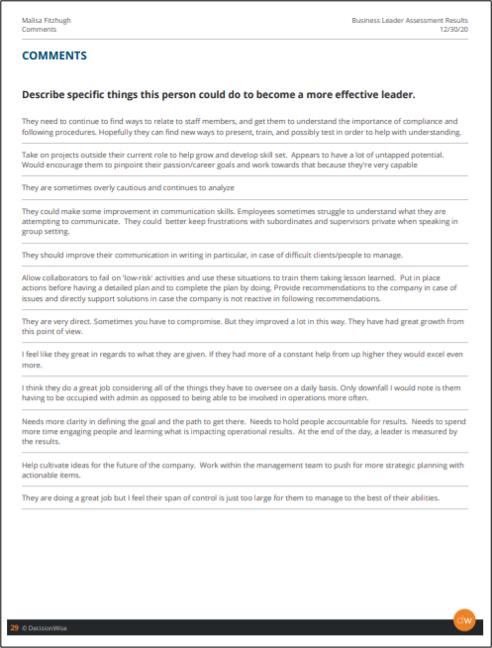
The “Comments” section of the report is standard. Open text comments represent direct, text-based feedback from questions in the assessment. Comments from each request will be shown on a new page. Comments are not translated by the system. They are shown in the language the rater used when entering the comments. If needed, comments can be translated and re-inserted, but that will require assistance from DecisionWise.  

Comments are randomized so the participant will not know who provided the feedback.

Currently, displaying the name of a rater who made a comment is not possible. If a rater would like to include their name, we recommend they include their name along with they feedback they provide the participant.  

Behavior Summary Page

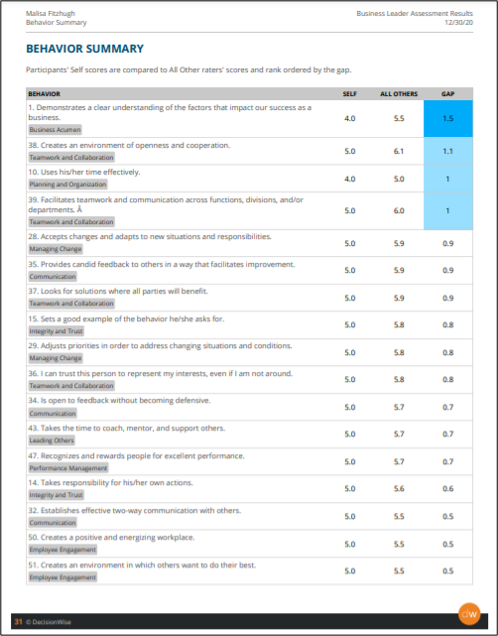
The “Behavior Summary” page shows each behavior statement rank-ordered by the highest positive gap to the most negative gap. Conditional highlighting is applied at a 1 or -1 point gap between self and the all others rater group. 

Action Planning Page

The DecisionWise PDF Action Planner is an optional addition to the report to help a participant organize their thoughts and efforts in creating meaningful change from the process. 

Prescriptive Recommendations Section

“Prescriptive Recommendations” is an optional section in the report. The contents of this section are managed in the “RX” section of the platform. There is an additional cost for this option. 

Recommendations are associated with each competency. There are 3 components of a recommendation:

  1. Think About: In this section you provide items for the participant to consider regarding the competency.
  2. Action Items: Here is where you would include action items you believe would be helpful to the participant.
  3. Media: You can insert links to internal or external media sources. As long as you have a URL, you can include it the report. Please Note: the PDF is interactive so a participant can simply click and follow the links embedded within the PDF.